

Blog
Actuarial Science: Secrets of the CSO Mortality Table

Introduction to Actuarial Science and the CSO Mortality Table
The study of actuarial science integrates finance, statistics, and mathematics to evaluate and control risks in the insurance sector. It’s a discipline that calls for a solid grasp of financial markets in addition to sophisticated analytical abilities. In figuring out insurance rates, figuring out reserves, and creating insurance products, actuaries are essential. The cso Mortality table is one of the most important tools actuaries use in their job.
A statistical tool that estimates the likelihood of dying at various ages is the Commissioners Standard Ordinary Mortality Table, or CSO Mortality Table. It offers insightful information on mortality and life expectancy rates, which is crucial for actuaries evaluating the financial risks related to life insurance contracts. The mortality table is based on a large amount of information gathered from numerous sources, such as insurance company records, population censuses, and national vital statistics.
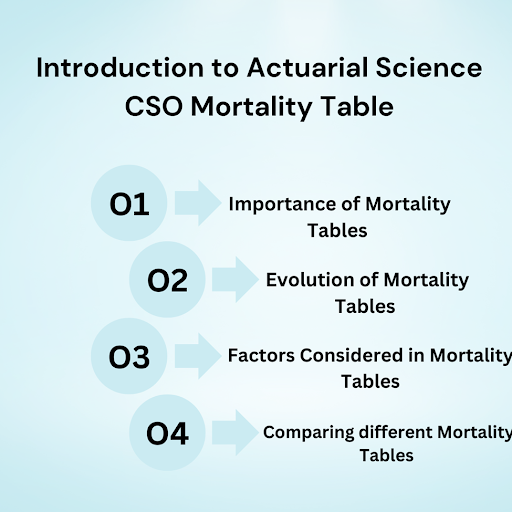
In order to have a deeper understanding of the CSO Mortality Table, let us examine several important observations and factors from several angles:
Explore More : https://theacademicjunction.co.in/
1. Importance of Mortality Tables:
Insurance firms use mortality tables to set the right premiums for life insurance plans. Actuaries can compute predicted claims and estimate the number of deaths that could occur within a particular population with the aid of these tables.
– They also help gauge the possible longevity risk that insurance providers may encounter. Actuaries can create plans to reduce this risk and guarantee the company’s financial stability by examining mortality rates.
2. Evolution of Mortality Tables:
– As cultural variables, lifestyle modifications, and medical developments have affected life expectancies, mortality tables have changed over time. These figures are updated on a regular basis by actuaries to account for shifting mortality trends.
– For example, the CSO 2017 Table, the most recent iteration of the CSO death Table, represents the higher life expectancies seen in recent years and includes updated death data.
3. Factors Considered in Mortality Tables:
– Mortality figures account for a number of variables, including age, gender, and health status, that can affect life expectancies. These statistics are used by actuaries to evaluate the mortality risk related to various demographic groups.
– The mortality tables may also take into account other variables like occupation, smoking status, and socioeconomic level, which can improve the prediction accuracy even more.
4. Comparing Different Mortality Tables:
– Although the CSO Mortality Table is frequently used in the US, mortality data from other nations might also exist. When evaluating risks, actuaries that operate globally must take these variances into account.
– Depending on the particular needs of their study, actuaries may also use alternate mortality tables, such as the Period Life Table from the Social Security Administration. Assessing the appropriateness and dependability of various tables in light of the situation is crucial.
Mortality tables are essential to actuarial science, and the CSO Mortality Table is a key resource for estimating life insurance risk. These tables are used by actuaries to determine premium amounts, manage longevity risk, and estimate the likelihood of dying at certain ages. Actuaries must comprehend the insights and factors related to mortality tables in order to generate precise forecasts and guarantee the financial stability of insurance firms.
Understanding Mortality Rates and Life Expectancy
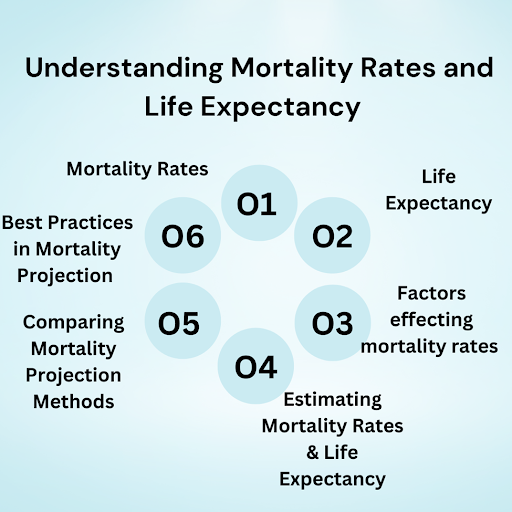
In the field of actuarial science, mortality rates and life expectancy are essential concepts since they serve as the basis for several computations and decision-making procedures. The complexities of death rates and life expectancy will be thoroughly examined in this part, along with their importance, contributing factors, and estimation techniques.
1. Mortality rates:
The number of deaths within a particular population during a specified period of time is referred to as the mortality rate. Usually, these rates are given as the number of deaths per 100,000 or per 100,000 people. Actuaries need to understand mortality rates because they shed light on population lifespan and aid in forecasting future patterns of death. Based on variables including age, gender, financial level, and geography, mortality rates might differ dramatically.
2. Life expectancy:
A statistical measure known as “life expectancy” calculates the typical lifespan of a population or a subset of it. Usually, death rates and other demographic data are used to calculate it. Actuaries utilize life expectancy as a useful metric to evaluate the financial risks involved in offering annuities, pensions, and other insurance products. Numerous variables impact it, including as improvements in healthcare, lifestyle decisions, and socioeconomic circumstances.
3. Factors affecting mortality rates and life expectancy:
Variations in life expectancy and death rates are caused by multiple variables. Due to the exponential rise in death rates with age, age is one of the most important determinants. Another factor that comes into play is gender; women often live longer than men do. Death rates and life expectancy can also be impacted by lifestyle decisions like smoking or exercising too much. Furthermore, increases in healthcare access and medical technology over time may result in longer life expectancies.
4. Estimating mortality rates and life expectancy:
Actuaries use a variety of techniques to calculate life expectancy and death rates. An strategy that is frequently employed is the analysis of historical mortality data, which entails estimating future mortality rates by looking at historical trends. Mortality tables, like the CSO Mortality Table, are another important resource for actuaries. They offer age-specific death probabilities based on observed data. To provide accurate estimations and reflect changes in mortality rates, these figures are updated on a regular basis.
5. Comparing mortality projection methods:
Actuaries have created a variety of models and methods for estimating life expectancy and mortality rates. The Lee-Carter model, the Cairns-Blake-Dowd (CBD) model, and the stochastic mortality model are a few often employed techniques. Every approach has advantages and disadvantages, and the best model to choose will rely on the particulars of the situation as well as the facts at hand. For instance, the CBD model has shown successful in capturing the short-term volatility in death rates, whereas the Lee-Carter model is frequently utilized for long-term projections.
6. Best practices in mortality projection:
Actuaries must take into account a number of considerations when choosing a mortality projection method, including the reliability of historical data, the accessibility of pertinent demographic data, and the intended projection horizon. Selecting a method that is in line with the particular requirements and goals of the actuarial study is essential. In order to take new trends and modifications to mortality patterns into consideration, actuaries need also periodically evaluate and update their mortality forecast models.
Actuaries need to have a solid understanding of mortality rates and life expectancy in order to appropriately assess risks and make well-informed decisions. Actuaries can help create solid insurance and pension solutions that meet the changing needs of people and society by understanding the causes impacting mortality rates, using trustworthy estimation techniques, and choosing suitable projection models.
The Evolution of the CSO Mortality Table
An essential instrument in actuarial science, the CSO Mortality Table aids insurance firms in evaluating the risk involved in life insurance policies. It gives insurers useful information about the likelihood of dying at certain ages, enabling them to set suitable rates and reserves. But as medical science advanced, life expectancy increased, and population demographics changed, the CSO Mortality Table changed as well. This section will examine the CSO Mortality Table’s growth and go over the several elements that have shaped it.
1. Historical Perspective:
The first CSO Mortality Table was created in the late 1800s using scant information from a particular community. Life expectancies rose as healthcare and medical knowledge advanced, necessitating the updating of mortality figures. To make sure the CSO Mortality Table appropriately depicts the mortality experience of the insured population, the Society of Actuaries (SOA) evaluates and updates it on a regular basis.
2. Data Collection and analysis:
The provision of precise and thorough data is essential to the development of the CSO Mortality Table. Actuaries gather information about mortality trends from governmental organizations, insurance companies, and other sources. In order to create mortality rates that accurately represent the wide range of features of the insured population, they take into account variables including age, gender, smoking habits, occupation, and geographic region.
3. Advances in Medical Technology:
The CSO Mortality Table and mortality rates have been greatly altered by medical developments. For example, the introduction of vaccinations and antibiotics has lowered the death rates from infectious diseases. Comparably, advances in medicine and surgery have raised the percentage of people who survive serious illnesses. In order to appropriately reflect the evolving risk landscape, actuaries must take these developments into account while updating the CSO Mortality Table.
4. Changes in Population Demographics:
The CSO Mortality Table has to be updated to reflect changes in immigration trends, birth rates, and lifestyle preferences. For instance, changes in death rates for older age groups have been brought about by the aging population and the rising frequency of chronic diseases. To make sure the CSO Mortality Table stays current and correct, actuaries must examine these demographic changes and make the necessary adjustments.
5. Comparison of Options:
Actuaries frequently weigh a variety of options while revising the CSO Mortality Table to choose the best course of action. They might assess alternative data sources, compare various statistical models, or examine the effects of incorporating more risk factors. Actuaries could compare, for instance, the outcomes of a more complex model that takes individual risk variables into account and a typical cohort method.
6. Best Option:
The optimal method for updating the CSO Mortality Table will depend on a number of variables, such as the insurance companies’ particular requirements, statistical robustness, and data availability. Actuaries work hard to achieve a balance between practicality and accuracy. They take into account how various solutions may affect policyholder protection, insurance rates, and financial stability. In the end, the optimal choice is one that takes into account insurers real-world limits and offers a trustworthy depiction of mortality risk.
Key Components of the CSO Mortality Table
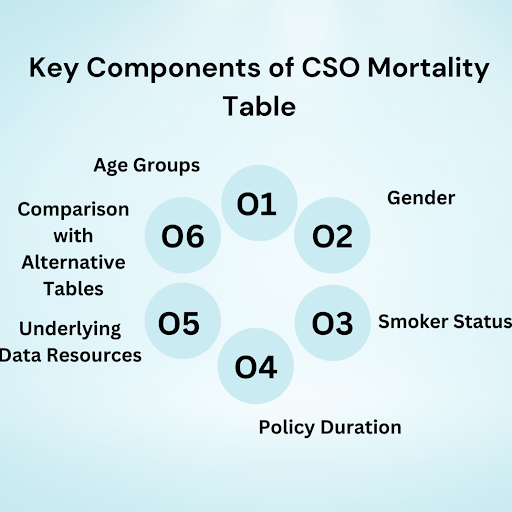
In the field of actuarial science, the CSO Mortality table is an essential resource since it offers insightful information about the mortality rates of people at various ages. Insurance companies, pension funds, and other financial organizations utilize these mortality statistics to evaluate risk and establish proper pricing and reserves. Actuaries and other industry experts must comprehend the fundamental elements of the CSO Mortality Table in order to appropriately evaluate and apply this data.
1. Age Groups:
Part of the core structure of the CSO Mortality Table is the division of people into age categories. Typically, these age categories are broken down into five-year intervals, such 0-4, 5-9, 10-14, and so forth. Individuals may be reliably tallied and studied for the death rates by grouping them into various age categories. Age-specific data is important since, for example, the death rate for people 0–4 may differ dramatically from that of people 5–9.
2. Gender:
Gender consideration is another important component of the CSO Mortality Table. It is commonly known that male and female death rates differ from one another. As an illustration, women often live longer than males do. To provide more accurate death rates for each age group, the CSO Mortality Table therefore accounts for these gender disparities. Insurers and pension funds can evaluate the risks connected with their policyholders or beneficiaries more effectively by integrating gender-specific data.
Know More : https://theacademicjunction.co.in/insurance-actuary/
3. Smoker Status:
It has long been known that smoking poses a serious risk to a number of illnesses and early deaths. Consequently, the CSO Mortality Table takes into account each person’s status as a smoker. Generally, there are three categories in the table: nonsmokers, smokers who are currently smoking, and former smokers. Because this difference takes into account the increased hazards associated with smoking, it enables a more sophisticated examination of mortality rates. For example, because smokers have a higher chance of death, insurers may raise their premiums.
4. Policy Duration:
The length of the policy or pension plan is also taken into consideration in the CSO Mortality Table. This component is very important since it helps determine the right pricing and reserves for pension funds and insurance firms. Individuals at different policy lengths may have varying death rates, which could be attributed to changes in overall mortality patterns, lifestyle choices, and health conditions. Insurers can guarantee that they have enough money to pay future claims and maintain their financial sustainability by taking policy term into account.
Analyzing Mortality Trends and Patterns
1. Actuaries must comprehend the significance of examining mortality trends and patterns in order to effectively evaluate and manage risk. Actuaries can forecast future death rates with confidence by looking at historical data and seeing trends. These forecasts are crucial for pricing insurance policies and figuring out reserves. This section will examine several facets of examining patterns and trends in mortality, offering insightful analysis from a variety of angles.
2. Historical Data Analysis:
Historical mortality data is used by actuaries to spot trends and patterns. They can determine whether death rates have changed over time and evaluate the effects of various factors, including socioeconomic variables, changes in lifestyle, and medical developments, by looking at data from prior years. For instance, examining death rates over the previous ten years may indicate either an increase in mortality as a result of aging populations or a drop in mortality as a result of better medical treatments.
3. Demographic Analysis:
Actuaries also examine mortality trends according to demographic variables like region, gender, and age. Mortality rates are significantly influenced by these factors. For example, looking at death rates by age group can point to particular patterns, such older people having greater death rates. In a similar vein, examining death rates by gender might highlight disparities in male and female life expectancies.
Interest Rates & Discount Rated
Note : Add here YT Video
4. Cause of Death Analysis:
Knowing the causes of death is another important component of analyzing mortality patterns. Actuaries look at death cause data to see if there are any changes in mortality trends brought on by particular illnesses or ailments. Analyzing the death rates associated with cardiovascular disorders, for example, may make it easier to determine how lifestyle modifications or medical improvements affect these conditions’ mortality rates.
5. Projection Models:
Based on past trends and patterns, projection models are used by actuaries to anticipate future death rates. These models take into account a number of variables, including modifications to healthcare, lifestyle, and socioeconomic circumstances. Actuaries can estimate future death rates using a variety of projection models, including period or cohort models. While period models take into account mortality rates for a certain era and extrapolate them for future years, cohort models concentrate on particular birth cohorts and project their mortality rates into the future.
6. Conclusion:
In actuarial science, analyzing mortality rates and patterns is essential. Actuaries can learn a great deal about mortality rates by looking at past data, demographics, causes of death, and utilizing projection models. They can efficiently manage risk, price insurance policies, and make accurate predictions thanks to this study. A thorough and reliable approach to actuarial work is ensured by comprehending the numerous facets of mortality analysis and taking into account a number of choices.
Implications of the CSO Mortality Table for Insurance Companies
An essential resource for insurance firms evaluating the risks attached to life insurance policies is the CSO Mortality Table. It helps insurers choose the right policy terms and premium rates by offering insightful information about the likelihood of dying at certain ages. The CSO Mortality Table’s ramifications go beyond pricing strategies, though. This section will examine the different implications that this table has for insurance firms, taking into account diverse viewpoints and investigating the most effective options.
1. Setting Premium Rates:
The CSO Mortality Table is used by insurance companies to determine how much to charge for life insurance contracts. The probability that policyholders would die within the policy term can be ascertained by insurers by examining the mortality rates at various age points. With the use of this data, they are able to determine the proper premium rates, taking prospective earnings and anticipated claims into account. For instance, insurers may raise premiums to offset the increased risk if a certain age group has high death rates.
2. Assessing Policy Liabilities:
An important tool for determining policy liability for insurance firms is the CSO Mortality Table. Insurance companies can predict the projected future claims and reserves needed to cover those claims by taking into account the mortality rates and life expectancies provided by the table. This evaluation is crucial to the company’s ability to remain solvent and meet its commitments to policyholders. In the event that the death rates for a specific age group exceed the projected rates, insurance companies could have to augment their reserves in order to address future claims.
3. Designing New Products:
Insurance firms can examine the mortality trends of various populations and demographics by using the CSO Mortality Table. This data is crucial for creating new life insurance products that are suited to particular clientele groups. Insurers might think about providing insurance with longer terms or cheaper premiums to entice clients from that age group, for instance, if the table shows lower death rates for that age group.
4. Managing Risk:
A few of the hazards that insurance firms face are mortality risk and other dangers that could jeopardize their financial viability. The CSO Mortality Table aids insurers in efficiently evaluating and controlling this risk. In order to distribute the risk among various age groups and demographics, insurers can diversify their policyholder portfolios by examining the death rates shown in the table. By using this risk management technique, the company’s financial performance is less likely to be negatively impacted by unanticipated death rates.
The Role of Actuaries in Utilizing the CSO Mortality Table
In the insurance business, actuaries are essential because they use their knowledge of finance, statistics, and mathematics to evaluate risk and set fair premiums. The CSO Mortality Table, which offers insightful information on mortality rates and life expectancy, is one of their main resources. We will look at the importance of actuaries using the CSO mortality Table and how it affects the insurance sector in this part.
1. Analyzing Historical data:
To assess trends in mortality rates, actuaries first examine historical data. To find trends and forecast death rates, they go through data from a variety of sources, including government statistics and insurance company records. To evaluate the effects of variables like lifestyle modifications and medical developments, scientists might, for instance, compare the death rates for various age groups and genders.
2. Selecting Appropriate Assumptions:
Actuaries base their predictions regarding future death rates on the CSO mortality Table. However, they also take into account additional variables including socioeconomic status, changes in lifestyle, and medical developments that may have an impact on life expectancy. Actuaries can better evaluate risk for insurance firms and produce more accurate estimates by taking these extra elements into account.
3. Pricing Insurance Policies:
Actuaries price insurance products efficiently by using the CSO Mortality Table. To estimate appropriate premiums, they take into account the time value of money, possible payouts, and the life expectancy of the covered individuals. Actuaries can make sure insurance companies charge premiums that sufficiently cover the risk of policyholder mortality while maintaining market competitiveness by employing the mortality table.
4. Considering Alternative Mortality Tables:
Actuaries look at alternate mortality tables in addition to the commonly used CSO Mortality Table in order to obtain more information. For future increases in life expectancy, they might modify the CSO Mortality Table using the SOA Mortality Improvement Scale. Actuaries can improve risk management and forecast outcomes more accurately by taking into account many tables.
In the insurance industry, actuaries are essential in assessing risk, determining insurance policy prices, analyzing long-term liabilities, and making well-informed judgments by using the CSO Mortality Table. Actuaries make ensuring that insurance firms are able to manage risk and give policyholders financial stability by looking at alternative mortality tables, evaluating historical data, and making suitable assumptions. Their proficiency with the CSO Mortality Table enables insurers to make defensible choices and guarantee the long-term sustainability of their operations.
Click to Know More : https://theacademicjunction.co.in/